Potassium Permanganate Using Horizontal Remediation Wells
Enhanced Delivery of Potassium Permanganate Using Horizontal Remediation Wells – Paper E-036, in: Bruce M. Sass (Conference Chair), Remediation of Chlorinated and Recalcitrant Compounds—2008.Proceedings of the Sixth International Conference on Remediation of Chlorinated and Recalcitrant Compounds (Monterey,CA; May 2008). ISBN 1-57477-163-9, published by Battelle, Columbus, OH, www.battelle.org/chlorcon . William M. Moran (The Shaw Group, Trenton, New Jersey)ABSTRACT
Commercial re-development of environmentally impacted land can require aggressive remediation schedules. Effective delivery of in-situ remediation agents is a key factor in meeting deadlines. In situ chemical oxidation (ISCO) was used to remove dry cleaning solvent from the subsurface beneath a large property in the Mid-Atlantic region of the United States. Directional drilling technology was used to install horizontal screens beneath buildings, streets, and utilities. Ten parallel horizontal wells were installed to inject potassium permanganate (KMNO4) solution. Well screens were between 130 and 330 feet long. Some of the wells were installed in pairs, with screens placed in target zones at 30-foot and 40-foot depths. Aquifer tests were used to evaluate hydraulic conductivity and anisotropy. A three-dimensional, finite difference flow and transport model was used to design well screens and define operational ranges of the injection system, including flow rates and pressures. KMNO4 solution was injected in two phases. In total 140 tons of KMNO4 were mixed to create 1.75 million gallons of solution. The use of horizontal wells allowed Shaw to inject into 10 horizontal wells instead of what would have been 120 vertical wells, and minimized our footprint on the Site. The ability to inject at 10 points into 2300 feet of well screen allowed for a higher injection rate than would have been accomplished using vertical wells. This resulted in our highest injection rate of 1.03 million gallons of KMNO4 solution in a 26-day period. After 6 months the KMNO4 solution remains persistent in the formation and has reduced tetrachloroethene (PCE) concentrations from 12 mg/L to non-detectable levels.
INTRODUCTION
The Site had been a regional shopping center for 60 years, but most of the tenants had vacated and what remained was the larger Main Parcel with abandoned buildings and a smaller parcel with an active dry cleaning facility. Sixty years of operations of the dry cleaning facility had resulted in soil and groundwater contamination at the Site, first noted in 1994. In 2004, the Site was purchased from the former owners with the intent to complete a major redevelopment of the Site for mixed commercial and residential use.
SITE SETTING
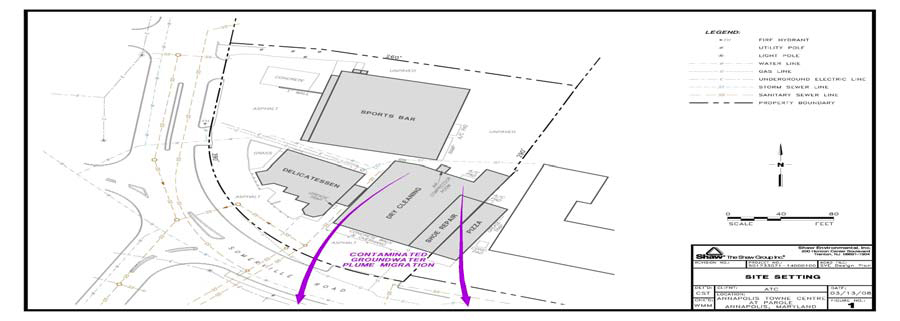
The Site is located on 35 acres in Maryland overlying the Aquia Formation, a water table aquifer with the depth to groundwater ranging from 15 to 25 feet below ground surface (bgs) at the Site. The dry cleaner is located on the Annex Parcel to the north and across a road from the Main Parcel. The underground utilities around the dry cleaner’s building, the road and its underground utilities near the source area, and utility corridors and building construction in the more downgradient area of the plume were limiting factors that made the use of a vertical injection well system impractical at this Site (Figure1).
CONCEPTUAL SITE MODEL
The majority of the dry cleaning solvent was released as a solution through a break in a pipe leading to the local POTW. This pipe break was located directly under the dry cleaning building. Concentrations of PCE in this discharge water were 2,000 mg/L. Concentrations of PCE in the discharge from the dry cleaning distillation unit were as high as 11,000 mg/L prior to mixing with other wastewaters from the facility. In 2004, when Shaw first became involved, the groundwater plume had migrated 1,600 feet from the source. The highest concentrations of PCE were found at depths of 25 to 45 feet bgs (Figure 2). There was no indication of the presence of a dense non-aqueous phase layer. Soils at the Site are primarily medium to fine sands and silty sands. The groundwater flow direction is to the south-southeast. Groundwater flow rates within this aquifer are 0.2 to 0.4 feet per day. Hydraulic conductivity generally decreased with depth. Soil oxidant demand (SOD) concentrations were determined to be 1.5 to 2.0 mg/L. There was little natural reductive dechlorination occurring even 1,600 feet from the source.

The placement of a sufficient number of vertical wells in the area of the plume was impractical due to the presence of streets and underground utilities. The horizontal well option was then explored.
HORIZONTAL WELL SCREEN DESIGN
The design of the screens for the horizontal wells was performed using modeling efforts to produce a screen pattern designed to achieve even distribution of the KMNO4 solution throughout the length of each horizontal well screen. Aquifer tests provided hydraulic conductivity and anisotropy data. A 3-D, finite difference flow and transport model of the injection wells was used to design the well screens and define operational ranges of the injection system, including flow rates and pressures. The groundwater modeling was performed using Waterloo Hydrogeologic’s Visual MODFLOW version 4.1.0.143. The model code is based on the finite difference method of solving partial differential equations describing groundwater flow. The design specifies the open area of the screen that allows uniform injection of fluid into the formation. This analysis consists of iterative calculations of pipe flow, orifice (slot) flow, and formation flow to generate the following parameters; pressure along the screen, flow through the screened pipe, and incremental and cumulative injection of fluid into the formation. The analysis requires definition of a series of pipe specifications and hydrogeologic parameters and was used to specify optimal operating conditions for each horizontal well. The model simulates the injection fluid moving down the well, through the well screen slots, and into and through the formation. The model provides the necessary open area along the length of the well screen to achieve uniformity of flow. The necessary open area requirements for the 10 wells ranged from 0.0357 to 0.0429 percent open area. Using a standard slot width of 0.02-inch, the required number of slots was calculated for each length of screen.
HORIZONTAL WELL INSTALLATION
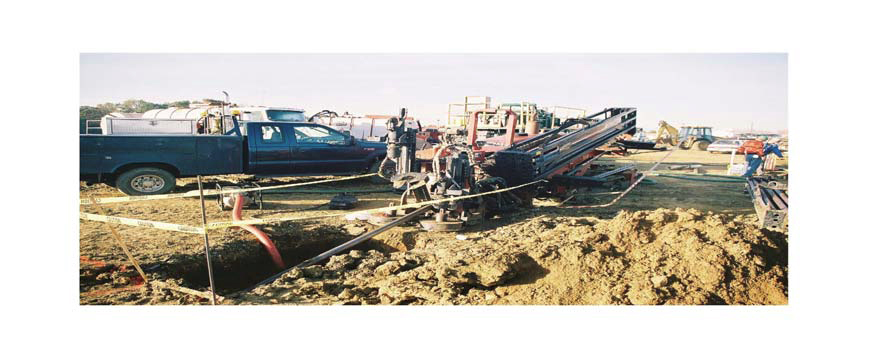
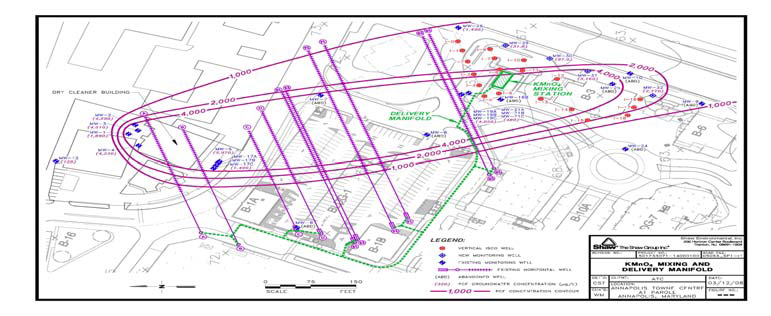
Directional drilling technology (Figure 3) was used to install the horizontal wells under utility corridors, buildings, and roads during the early stages of construction of commercial and residential buildings. The horizontal well screens were placed in the heaviest contaminated zones without having to deal with interferences from underground utilities and access issues associated with drilling in public roadways. Well screens were between 130 and 330 feet long (Figure 4). The wells were drilled as blind wells, without exit points. Wells nearest the source were screened at 30 feet bgs. Wells further downgradient were paired to be screened at target zones of 30 and 40 feet bgs (Figure 5).

FIRST INJECTION
In the first phase, 56,000 pounds of KMNO4 were mixed to create 340,000 gallons of 2-
percent KMNO4 solution injected into the 10 horizontal wells. The delivery rate per unit length of screen was generally uniform. The longest well injected at more than 16 gallons per minute. An HDPE manifold transferred KMNO4 solution to the 10 well heads.
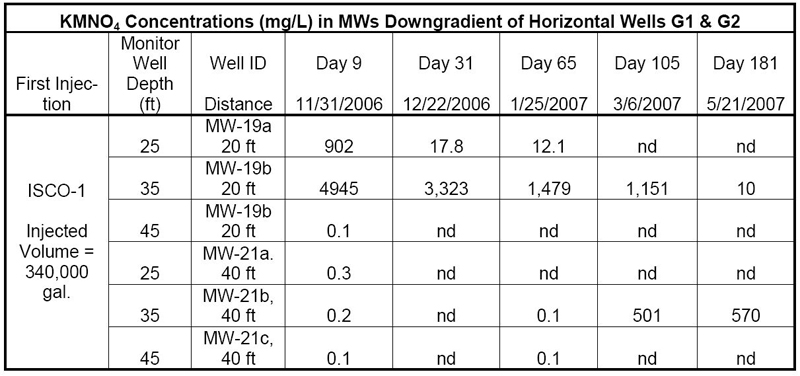
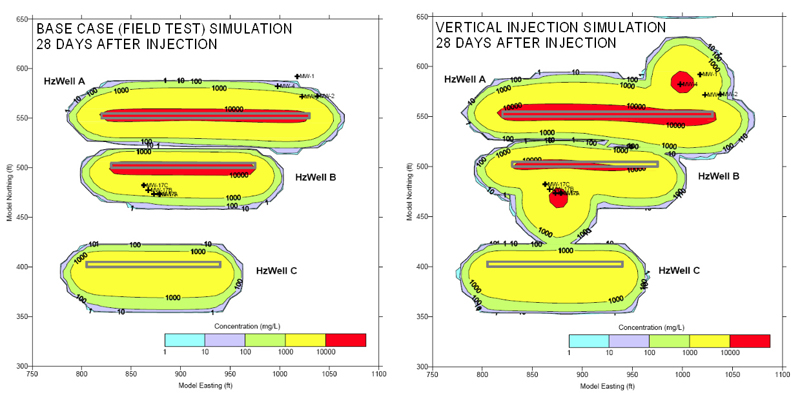
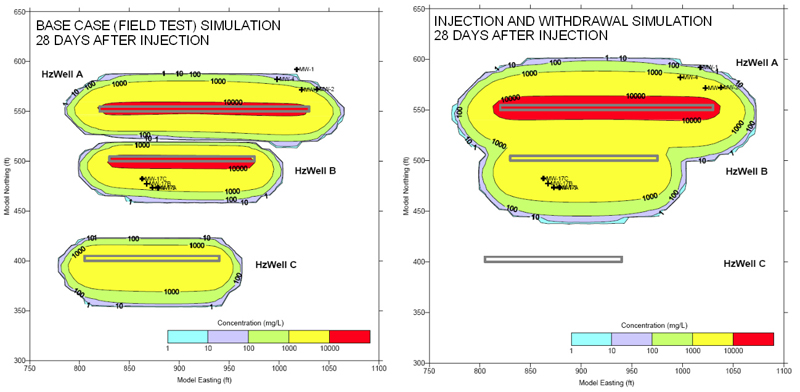
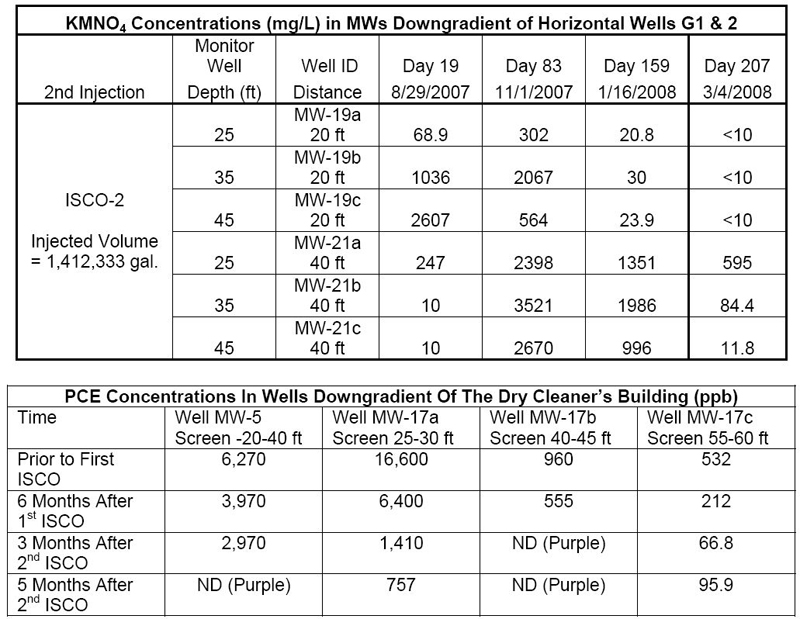
The KMNO4 injection model developed in the design phase of the project was recalibrated using data collected during and after the first injection. Hydraulic data confirmed the accuracy of anisotropy values previously derived from analyses of a vertical pumping test performed in support of the design of the injection system. The first injection indicated zones of delayed arrival of KMNO4 between certain wells. The three-dimensional model was used to simulate the first injection, and assess various alternatives for improved delivery of KMNO4. The difference between pulsed injection, as executed during the first injection phase, and a continuous, 30-day injection of equal volume of KMNO4 solution is illustrated by the injection simulation cross sections in Figure 6. The model simulation shows that the differences between the two injection schemes are minor and appear mainly at the down-gradient edge of the injected KMNO4. The base case simulation of three horizontal wells with variable spacing is shown in Figure 7, along with an alternative injection scenario using vertical and horizontal injection wells. The base case shows a zone of delayed arrival of KMNO4 between adjacent horizontal wells, on the left hand side of Figure 7. The alternative scenario simulation shown on right hand side of Figure 7 uses vertical wells to accelerate KMNO4 delivery. The alternative scenario also illustrates minor adjustments in the distribution of KMNO4 around the horizontal wells, resulting from the vertical well injection. Cross sections of these two scenarios are shown in Figure 8. Comparison of the base case with the alternative scenario shows that the vertical wells fill in the zone of delayed arrival to similar depths as the horizontal wells. Minor impact of a vertical well on the adjacent horizontal well is seen at the downgradient edge of the injected KMNO4. The simulations shown in Figure 9 illustrate the effect of using a combination of horizontal injection and extraction wells. One well on the right hand side of Figure 9 withdraws groundwater while the other two are injecting KMNO4. This allows KMNO4 to spread more quickly into the zone of delayed arrival than in the base case, shown on the left hand side of Figure 9. These simulations of alternative injection scenarios provided valuable information that was considered in planning the second injection phase. During the injection, KMNO4 concentrations were monitored at three depths as shown in Figures 10 and 11.


SECOND INJECTION
In the second phase, 84 tons of KMNO4 were injected into the horizontal wells. Then 30 tons were injected into newly installed supplemental vertical wells. The use of an automated mixing system with two 18,000-gallon mixing tanks allowed the mixing and injection of up to three tons of KMNO4 or 55,000 gallons of KMNO4 solution per shift. The batch process entailed a fire hydrant to put approximately 1,650 pounds of KMNO4 into solution. This would create 10,000 gallons of solution stored in one of the 18,000- gallon mixing tanks. Because of the combined screen length of the 10 horizontal wells, the KMNO4 solution was be pumped from the mixing tank at 115 gallons per minute. At the same time a second 10,000 gallon batch could be prepared. During this second injection, our production rate was maximized so that we were able to inject 1.03 million gallons of KMNO4 solution in a 26-day period.
PERFORMANCE EVALUATION
Monitoring wells were installed to monitor the distribution of the KMNO4 solution as wells as the PCE concentrations.


SUMMARY
The use of horizontal wells allowed Shaw to inject into 10 horizontal wells instead of 120 vertical wells. This minimized our footprint on the Site and helped to keep our ISCO project going during heavy Site redevelopment work by our client. The ability to inject at 10 points into 2200 feet of well screen allowed for a higher injection rate than would have been accomplished using vertical wells. This resulted in an injection rate of 1.03 million gallons of KMNO4 solution in a 26-day period, our most productive period. The use of horizontal wells resulted in a shorter injection time frame than would have occurred with vertical wells and minimized impacts to our client’s development work and schedule. Horizontal wells screens were determined to be more efficient at distributing KMNO4 into the zone where the highest contamination was present. After more than 6 months the KMNO4 solution remains persistent in the formation and has reduced PCE concentrations from 12 mg/L to non-detectable levels. Our client is completing their Site redevelopment and is scheduled to open this fall.